| 일 | 월 | 화 | 수 | 목 | 금 | 토 |
|---|---|---|---|---|---|---|
| 1 | 2 | 3 | 4 | 5 | ||
| 6 | 7 | 8 | 9 | 10 | 11 | 12 |
| 13 | 14 | 15 | 16 | 17 | 18 | 19 |
| 20 | 21 | 22 | 23 | 24 | 25 | 26 |
| 27 | 28 | 29 | 30 | 31 |
Tags
- java
- vsc
- 초보 개발자
- resutful api
- html
- MYSQL
- ui인터페이스
- 여러 종류의 사용자 정의 함수
- 자바빈
- 자바
- JavaScript
- github
- 게시판
- IndexedDB
- 실시간 상태값 저장
- jsp
- css
- tomcat
- 자바스크립트
- spring boot
- 데이터 시각화
- chart.js 라이브러리
- thymeleaf
- 상태값 저장 유지
- @requstbody
- Eclipse
- git
- vscode
- chart.js
- open in browser
Archives
- Today
- Total
수월한 IT
Chart.js를 사용한 차트 만들기 본문
728x90
안녕하세요 IT여행자입니다. 이번 여행지는 Chart.js 라이브러리를 사용하여 차트 만들기 입니다. 차트를 만드는 라이브러리나 API는 그 종류가 굉장히 많이 있지만 Chart.js는 자바 스크립트를 사용하여 간단히 차트를 만들수 있는 라이브러리 입니다.
여행 방법은 아래와 같습니다.
1. CDN 형태로 라이브러리 가져오기
라이브러리를 다운로드 받아 프로젝트내에 포함시킬 수 도 있습니다.
<script src= "https://cdn.jsdelivr.net/npm/chart.js"></script>
2. 기본 골격
데이터를 생성하는 언어는 JSP를 사용하였지만 어떤 언어이든 상관없습니다. 데이터를 자바스크립트로 전달 할 수만 있으면 상관 없습니다.
<%@ page language="java" contentType="text/html; charset=UTF-8"
    pageEncoding="UTF-8"%>
<!DOCTYPE html>
<html>
<head>
<meta http-equiv="Content-Type" content="text/html; charset=UTF-8">
<title>Insert title here</title>
<style>
#here{
	width:500px;
	height:350xp;
	border:3px solid #aaa;
}
</style>
<script src= "https://cdn.jsdelivr.net/npm/chart.js"></script>
</head>
<body>
<h1>line type 1</h1>
<div id='here'>
  <canvas id="myChart"></canvas>
</div>
<%
String labels = "['A','B','C','D','E','F', 'g']";
String value = "[23,42,5,57,35,34,88]";
request.setAttribute("value", value);
%>

<script>
  const ctx = document.getElementById('myChart');
  new Chart(ctx, {
    type: 'bar',
    data: {
      labels: <%=labels%>,
      datasets: [{
        label: '# of Votes',
        data: ${value},
        borderWidth: 1
      }]
    },
    options: {
      scales: {
        y: {
          beginAtZero: true
        }
      }
    }
  });
</script>
</body>
</html>
특별한 이유는 없지만 <%%>를 사용하여 차트의 라벩값을 자바스크립트에서 사용하였고, 데이터는 request 영역에 담아 사용토록 하였습니다. 또는 자바스크립트 함수 파라메터로 전달해도 상관없을 것입니다.

3. 대표적인 차트 유형
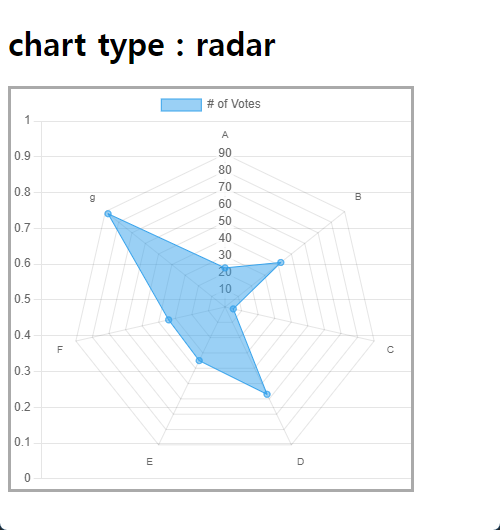
line, bar, doughnut, polarArea, radar 는 같은 데이터셋을 사용하여 차트를 만들어 낼 수 있습니다.
new Chart(ctx, {
type : 'line',
...
})
type : 'line',
...
})


bubble
데이터를 x, y, r 의 형태로 만든다.
<%@ page language="java" contentType="text/html; charset=UTF-8"
    pageEncoding="UTF-8"%>
<!DOCTYPE html>
<html>
<head>
<meta http-equiv="Content-Type" content="text/html; charset=UTF-8">
<title>Insert title here</title>
<style>
#here{
	width:400px;
	height:400xp;
	border:3px solid #aaa;
}
</style>
<script src= "https://cdn.jsdelivr.net/npm/chart.js"></script>
</head>
<body>
<h1>chart type : bubble</h1>
<div id='here'>
  <canvas id="myChart"></canvas>
</div>
<script>
  const ctx = document.getElementById('myChart');
  const data = {
		  datasets : [{
			  label : 'bubble',
	    	  data : [
	    		  {x:20, y:10, r:5},
	    		  {x:40, y:20, r:5},
	    		  {x:50, y:30, r:5},
	    		  {x:60, y:40, r:5}

	    	  ]
		  }]
  }

  new Chart(ctx, {
    type: 'bubble',
    data: data,
    options: {
      scales: {
        y: {
          beginAtZero: true
        }
      }
    }
  });
</script>
</body>
</html>
scatter(산점도)
데이터를 x,y값으로 나타낸다.
<%@ page language="java" contentType="text/html; charset=UTF-8"
    pageEncoding="UTF-8"%>
<!DOCTYPE html>
<html>
<head>
<meta http-equiv="Content-Type" content="text/html; charset=UTF-8">
<title>Insert title here</title>
<style>
#here{
	width:400px;
	height:400xp;
	border:3px solid #aaa;
}
</style>
<script src= "https://cdn.jsdelivr.net/npm/chart.js"></script>
</head>
<body>
<h1>chart type : scatter</h1>
<div id='here'>
  <canvas id="myChart"></canvas>
</div>
<script>
  const ctx = document.getElementById('myChart');
  const data = {
		  datasets : [{
			  label : 'bubble',
	    	  data : [
	    		  {x:20, y:10},
	    		  {x:40, y:20},
	    		  {x:50, y:30},
	    		  {x:60, y:40}
	    	  ]
		  }]
  }

  new Chart(ctx, {
    type: 'scatter',
    data: data,
    options: {
      scales: {
        y: {
          beginAtZero: true
        }
      }
    }
  });
</script>
</body>
</html>

보다 자세한 내용은 https://www.chartjs.org/docs/latest/ 을 참조해 보시길 바랍니다.
이상 IT여행자의 수첩이였습니다.
'작은 모듈(IT구슬)' 카테고리의 다른 글
| eclipse냐 vscode 이냐? 아니면 둘다? (2) | 2023.07.01 |
|---|---|
| 주석 처리는 이것으로... (1) | 2023.02.06 |
| ubuntu에서 ssh, tomcat, mysql 설치 및 설정하기 (1) | 2023.01.11 |
| 이클립스에서 javascript theme 지정하기 (0) | 2022.11.20 |
| favicon 오류? (1) | 2022.11.18 |


